Key Takeaways
- The mobile app industry in 2026 is shifting toward utility-first experiences, users expect instant value and seamless integration into workflows.
- Revenue growth is driven by subscriptions, in-app purchases, AI-powered services, with non-gaming sectors like fintech and health leading market.
- User behavior now favors hyper-personalization, intent-based interactions, cross-platform continuity, making retention and real-time delivery essential.
- Future success depends on AI-first strategies, scalable architectures, global readiness, strong security, as apps evolve into intelligent ecosystems.
- How Idea Usher can help you develop mobile apps by leveraging AI-first design, scalable architectures, data-driven strategies to build applications tailored growth.
What if the real threat to your mobile app is user indifference to apps themselves? The old playbook of building apps and chasing retention is breaking. Users now care about instant outcomes, speed, and seamless experiences, not brands or interfaces. If your product does not deliver value immediately or fit into their daily flow, it gets ignored.
Discovery is moving beyond app stores, and engagement is becoming contextual, not habitual. Feature-heavy apps and long onboarding flows are giving way to lightweight, interoperable products. The opportunity is clear: success in 2026 will belong to those who build adaptive systems of engagement, not standalone apps.
This blog will explore the most recent trends and data in the mobile app industry, which are expected to have a significant impact on the sector’s future. We’ll look at well-liked app categories, financial structures, user behavior, and much more. This blog will offer insightful information on what the mobile app business may expect in 2026 and beyond.
Mobile App Industry: The Most Important Statistics
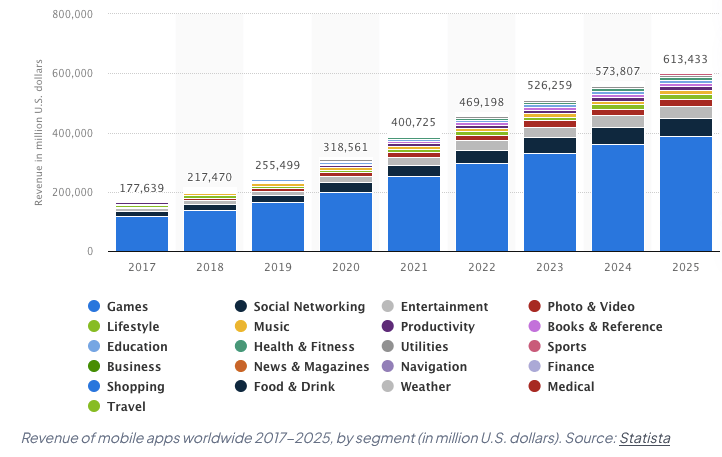
- By 2025, revenue from mobile apps is expected to increase across most segments and reach a total of around $613 billion.
- In 2023, mobile apps are expected to generate revenue exceeding $935 billion.
- The combined number of mobile apps on the Google Play Store and Apple App Store exceeds 5.7 million.
- The Apple App Store alone has a library of more than 2.2 million mobile applications.
- The Google Play and Apple App Store generated a combined revenue of $111 billion in 2021.
- A typical smartphone user accesses around 9-10 apps daily and 30 apps monthly.
- On average, an individual in the United States has about 80 apps installed on their smartphone.
- Mobile applications account for 85% of the total time spent on smartphones by users.
- In 2020, global app downloads reached a staggering 299 billion.
- With a market share of 85%, Android is the most widely used mobile operating system globally, with over three billion active users and a total of 108 billion downloads in 2020.
- The projected size of the global e-learning market is set to reach $650 billion by 2025, with a Compound Annual Growth Rate (CAGR) of 21% expected between 2021 and 2027.
Mobile App Economy Overview
According to a report by App Annie and Statista, between 2019 and 2020, there was a daily average of over 250 million app downloads, which amounts to more than 91 billion downloads annually.
Experts predicted that this number would continue to grow, and by 2025, it may reach as high as 500 million daily downloads, which would translate to 184 billion app downloads at the end of that year – twice the number recorded in 2020.
According to a report by Business of Apps, an interesting fact is that 98% of the revenue of Google Play comes from free apps. Although they do not require any payment to be downloaded, free apps serve as a marketing tool and can generate revenue through advertising. For instance, McDonald’s frequently creates gaming apps aimed at children to promote their brand. Therefore, free apps and advertisements are surprisingly useful for generating revenue.
As of 2022, the global consumer expenditure on apps has reached $129 billion. This is a massive sum, but it represents a slight decrease from the previous year when consumers spent approximately $133 billion on apps. In other words, there has been a 3% reduction in consumer spending on apps in just one year.

Global App Revenue 2026
According to Sensor Tower, in 2024 consumer spending on in-app purchases and subscriptions hit $150 billion globally, an increase of 13% year-over-year. Consumers also remain as connected to their smartphones as ever, with 4.2 trillion (+5.8% YoY) total hours spent on mobile worldwide last year. For the strategic investor, these figures represent more than just usage. They signal a permanent migration of global capital into the app ecosystem.
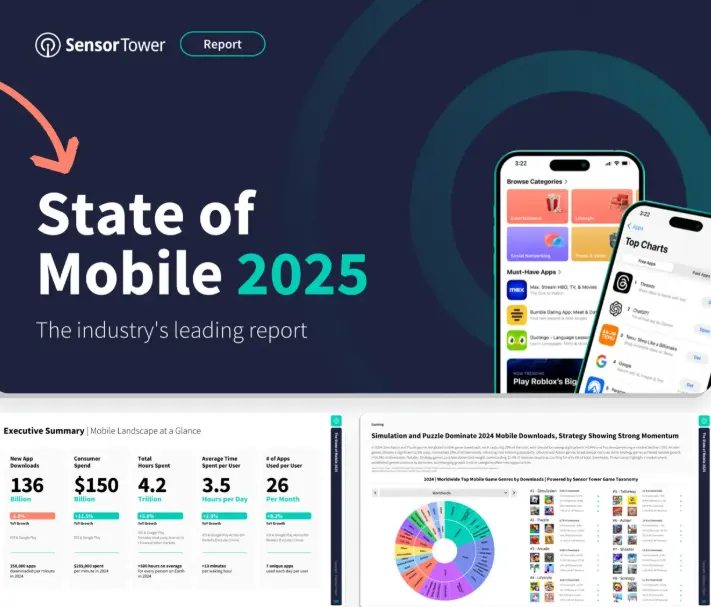
Source: Sensor Tower
By 2026, the market is maturing into a utility-first era. Revenue is no longer driven solely by the volume of downloads but by the depth of integration into a user’s daily workflow or lifestyle. MarketBiz reports indicate that mobile ad spend is projected to exceed $400 billion by 2026, capturing over 75% of total digital advertising expenditure. Modern investors must recognize that the barrier to entry has risen.
- Data-Driven Monetization: High-valuation platforms use sophisticated data modeling to optimize recurring subscription tiers and predict user churn.
- Wallet Share Focus: The race for eyeballs has shifted to a competition for wallet share, requiring technical architecture that supports frictionless global transactions.
- Global Scalability: Success depends on understanding regional shifts and building infrastructure that handles localized payment gateways and digital tax laws.
- Adaptive Models: Platforms must pivot between direct commerce, advertising arbitrage, or gated content based on specific regional consumer behaviors.
Top Revenue Categories
Identifying where capital flows is the first step in mitigating investment risk. In 2026, revenue concentration is most dense within categories that provide either high-stakes utility or personalized entertainment. Social media remains a dominant force, but its revenue model has evolved from pure advertising to creator-led social commerce and tipping ecosystems.
For instance, TikTok continues to lead global charts with over $3.3 billion in annual consumer spend, primarily driven by virtual gifting rather than traditional ads. However, for a new entrant, the most aggressive growth is currently found in specialized sectors:
- Health and Bio-Optimization: Moving beyond simple step counters, apps that integrate with wearable tech and offer AI-driven medical or fitness coaching command premium subscription prices.
- FinTech and Neo-Banking: As traditional banking continues to lag in user experience, platforms offering integrated wealth management, micro-investing, and cross-border crypto-fiat gateways are capturing significant transaction fees.
- B2B Productivity and SaaS: Mobile-first tools for the fractional workforce and decentralized teams are seeing a surge in enterprise-grade subscriptions.
- AI-Native Content Engines: Platforms that utilize generative AI to provide customized educational paths or professional-grade creative tools are seeing faster monetization cycles. ChatGPT alone has surged to over $3.4 billion in annual in-app revenue, proving that users will pay for intelligence as a service.
Evolving Spending Behavior
The psychology of the mobile consumer has undergone a fundamental transformation. We are seeing a flight to quality where users are willing to pay a premium to remove friction or gain a competitive edge. The era of the one-time pro version purchase has largely been replaced by tiered subscription models and micro-transactions that offer immediate, tangible value.
Notably, consumer spend on non-gaming apps has surpassed gaming revenue in several key markets for the first time, reflecting a shift toward long-term digital services over transient entertainment. Strategically, investors must note the rise of subscription fatigue, which is being countered by bundled services and flexible pay-as-you-go models.
In emerging markets, spending is often driven by social proof and community-based commerce, whereas in mature markets, the spend is motivated by time-saving and efficiency. Understanding this nuance is critical when designing a monetization roadmap. Your platform must be architected to pivot its billing logic based on the user’s geographic and psychographic profile.
Faster Revenue Capture
To achieve a rapid ROI, new platforms must target the whitespace between bloated legacy apps and hyper-niche utilities. The fastest path to revenue in 2026 lies in Vertical Integration. Instead of building a generic social platform, successful entrepreneurs are building platforms that own a specific niche end-to-end. For example, a marketplace for renewable energy installers that includes project management, financing, and client communication in one ecosystem.
Another high-velocity revenue stream is AI-as-a-Service within mobile interfaces. By solving a specific, high-value problem, such as automated legal document review or real-time language translation for international trade, apps can bypass the long customer acquisition cycles of lifestyle apps.
Furthermore, capturing revenue faster today requires a Global-First mindset. Launching with multi-currency support and localized UX from day one allows you to tap into high-growth corridors in Southeast Asia and Latin America, where mobile-first spending is outpacing desktop-legacy regions.
The Latest Mobile App User Stats: 2026 Update
The mobile ecosystem is defined by hyper-personalization and the integration of utility into every waking hour. Understanding the modern user requires looking beyond surface-level engagement metrics and analyzing the psychological drivers of digital consumption. According to data from Criteo, mobile applications now generate a 3x higher conversion rate than mobile-optimized websites, underscoring that users are far more likely to complete a transaction within a dedicated app environment than a browser.
The metrics have evolved for those leading these ventures. It is no longer enough to track how many people opened an app. The priority is now the intensity of the session and the speed at which a user achieves their desired outcome. The current data reflects a user base that is increasingly efficient, demanding, and highly mobile-centric.
Daily Time Spent
The most recent data confirms that mobile devices have become the primary interface for human experience. Global daily time spent on mobile apps has reached a staggering average of 5.2 hours per user. This is not merely a quantitative increase but a qualitative shift in how that time is distributed across different sectors.
Market data suggests that e-commerce app users are 18x more engaged than those on mobile websites. Shoppers spend an average of 201.8 minutes per month in-app compared to just 10.9 minutes on the mobile web. This disparity highlights a massive gap in engagement depth that only native applications can bridge.
- Social and Communication: 42% of daily usage is dedicated to interactive platforms where commerce and community intersect.
- Utility and Productivity: 18% of time is now spent on background apps. These are tools that manage home automation, health monitoring, and financial logistics.
- Entertainment and Streaming: 25% of usage occurs in short-form video or high-fidelity streaming environments.
- Other (Shopping, Travel, Gaming): 15% of the daily share.
From a strategic standpoint, this concentration of time suggests that the most successful platforms are those that occupy a permanent slot in the user’s cognitive load. Priority should be placed on platforms that demonstrate high-frequency utility. These are apps that a user feels compelled to check more than ten times a day to manage their life or business.
Retention Trends
Retention is the ultimate validator of product-market fit. The current benchmark for a successful app is a Day-30 retention rate of 15% or higher, yet the top-performing 1% of apps are seeing rates closer to 35%. High-retention apps are moving away from generic push notifications toward predictive interventions. Instead of asking a user to return, these apps utilize AI to provide value precisely when the user is most likely to need it.
For example, a financial app might flag a subscription price hike the moment it happens. Successful retention strategies now focus on three core pillars:
- Immediate Value Realization: Reducing the onboarding friction so the user experiences the key benefit in under 60 seconds.
- Community-Led Growth: Building social loops where the presence of other users adds intrinsic value to the platform.
- Gamified Progression: Implementing non-intrusive reward systems that recognize long-term loyalty rather than just short-term streaks.
Key Behavior Shifts
To build a resilient platform, the strategy must anticipate the subtle shifts in how users interact with their screens. The most significant shift is the move toward Intent-Based Search within apps. Users are increasingly bypassing traditional search engines to search directly within specialized platforms. They are searching for products on social commerce apps or travel advice on community-driven forums.
| Shift Category | From (Legacy Behavior) | To (Modern Behavior) |
| Interface | Tap and Scroll | Voice and Gesture-Led AI |
| Privacy | Passive Acceptance | Proactive Data Governance |
| Discovery | Algorithmic Feed | Curated Human Recommendations |
| Transaction | Multi-Step Checkout | Single-Tap Biometric Payments |
The most critical behavior to track is the cross-platform transition. Users now expect a seamless experience as they move from a mobile app to a wearable device or a desktop environment. If a platform cannot synchronize state and intent in real-time across these touchpoints, it risks losing the user to a more integrated competitor. The modern user does not see apps as separate entities. They see them as extensions of a singular, continuous digital identity.
Smartphone Users Statistics
As per the data provided by PewResearch, the typical smartphone user in the United States:
- Is predominantly male.
- Among the total population of smartphone owners, 80% are males, and 75% are females falling within the age range of 18 to 29 years old.
- The age group of 18 to 29 years old has the highest percentage of smartphone users, standing at 94%.
- The subsequent age group of 30 to 49-year-olds holds the second-highest percentage of smartphone users, with 89%.
- The proportion of smartphone users drops further among the age groups of 50 to 64-year-olds (73%) and 65 years or above (46%).
The table below presents an estimation of the growth of smartphone usage since 2016:
| Year | Number of Smartphone Users | Growth Over the Previous Year | Percentage Growth Over Previous Year |
| 2016 | 3.668 billion | – | – |
| 2017 | 4.435 billion | + 767 million | + 20.91% |
| 2018 | 5.095 billion | + 660 million | + 14.88% |
| 2019 | 5.623 billion | + 528 million | + 10.36% |
| 2020 | 5.924 billion | + 301 million | + 5.35% |
| 2021 | 6.259 billion | + 335 million | + 5.65% |
| 2022 | 6.567 billion | + 308 million | + 4.92% |
- Checks phone:
On average, Americans check their phone every 10-12 minutes, at least 96 times a day. However, statistics suggest that 66% of Americans check their phones up to 160 times a day.
- Time spent:
Americans typically spend a minimum of 5 hours on their phones daily, with nearly half the population spending between 5-6 hours and 22% spending 3-4 hours daily. Less than 5% of Americans spend less than an hour on their phones each day.
- App downloads:
A significant majority of smartphone users, accounting for 62%, would not download an app to complete a transaction. Of the remaining 38%, half would uninstall the app once their purchase is completed.
- Desktop/Mobile:
Americans still prefer desktops over mobile devices by 1.87%, spending an average of 3 hours 34 minutes on desktops and 3 hours 30 minutes on mobile devices, despite mobile devices being more popular worldwide.
OS Market Share
According to a report by IDC and StatCounter, the significance of OS market share lies in its ability to aid in the assessment of the favored platform for mobile applications. Understanding the market share of operating systems can provide valuable insight into which platforms are more commonly used, which will help in making informed decisions about which systems to prioritize when creating/investing in mobile applications.
As of January 2023,
- Android holds a 71.63% market share in the operating system (OS) market.
- iOS has a 27.68% market share in the OS market.
- Samsung’s market share in the OS market is 0.35%.
- KaiOS holds a 0.11% market share in the OS market.
- Windows has a 0.02% market share in the OS market.
- Nokia Unknown has a 0.01% market share in the OS market.
- Linux holds a 0.01% market share in the OS market.
In the US market, iOS leads with a market share of 55.85%, while Android claims a market share of 41.89%.
Trends And Projections In The Mobile App Industry
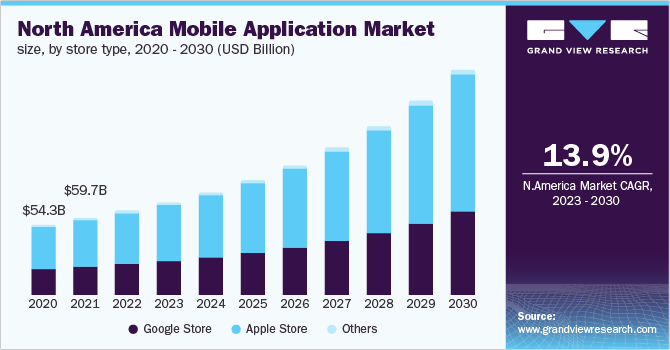
In 2022, the worldwide market for mobile applications was valued at USD 206.85 billion, with projections indicating a compound annual growth rate (CAGR) of 13.8% between 2023 and 2030. As we move forward, this sector is predicted to continue expanding at a significant pace.
Mobile app usage has been rising for several years, with no signs of slowing down. Below are some key facts and projections regarding trends in the mobile app industry:
- The mobile app industry is expected to generate revenue of $201 billion by the end of 2023.
- Mobile app revenue is experiencing impressive growth, with a CAGR of 19.5%. By 2025, consumer app spending may exceed $270 billion.
- Global installs of shopping apps rose by 10% between 2020 and 2021. Usage of these apps has grown even more significantly, at a rate of 30% year-over-year, indicating an increased preference for online shopping.
- TikTok emerged as the most downloaded app in 2022, with 104 million downloads in February alone. This represents a 46% increase from January 2021. Globally, TikTok amassed over 2 billion downloads in 2021 alone.
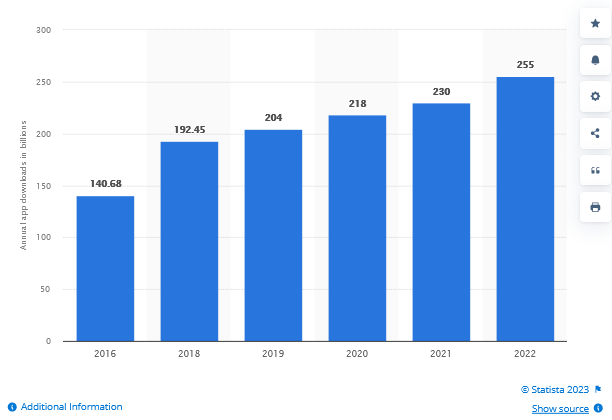
- From 2016 to 2021, yearly global app downloads have increased by 63.5%, from 140.68 billion to 230 billion downloads yearly.
- Business app downloads experienced a substantial increase of 102% in 2020, driven by the COVID-19 pandemic’s effects on remote work. In March 2020, business app downloads spiked by 225%.
Mobile App Category Trends Shaping Demand in 2026
Market leadership in the mobile app economy has reached a tipping point where utility and longevity outpace fleeting trends. The current landscape is defined by a shift toward platforms that offer specialized value, with consumers moving away from generic tools in favor of category-specific intelligence.
For those deploying capital, success now depends on identifying which sectors are seeing a genuine surge in wallet share versus those that are merely maintaining download volume.
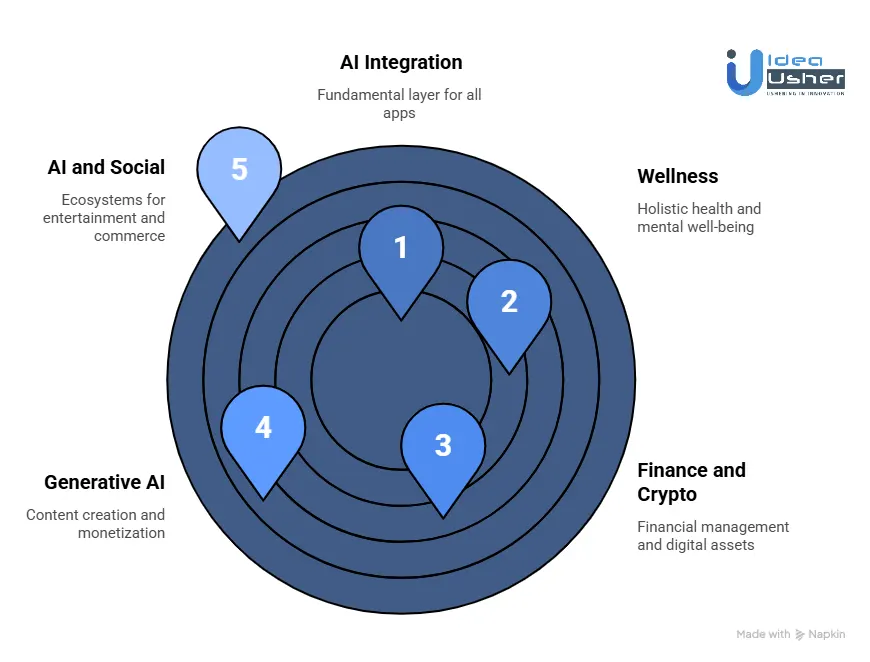
1. AI and Social Dominance
The dominance of AI and social platforms is no longer about novelty. It is about infrastructure. High-performance social apps have transitioned into all-in-one ecosystems that combine entertainment, search, and commerce. TikTok continues to lead global charts, with shoppers spending an average of $95 per product recommended by trusted influencers.
Simultaneously, AI assistants like ChatGPT have crossed the threshold from experimental tools to daily essentials. ChatGPT has hit a milestone of 900 million weekly active users, generating approximately $2 billion in monthly revenue. These apps lead installs because they have successfully collapsed multiple user workflows, such as search, drafting, and problem-solving, into a single interface.
2. Generative AI Revenue
Generative AI has emerged as the fastest-growing segment in the history of the app stores. With downloads surpassing the 1.7 billion mark, the transition from curiosity to monetization is complete. Market data suggests the global generative AI market is on track to reach $55 billion this year, driven by high-intent users willing to pay for premium intelligence.
| Metric | Growth Detail |
| Global Revenue | $25 Billion annualized for top AI players |
| Adoption | 92% of Fortune 500 companies use AI-native tools |
| Market Share | ChatGPT holds ~68% of the AI chatbot market |
| Leading Sub-sector | Software segment captures over 65% of AI revenue |
3. Non-Gaming Growth
Consumers are now spending more money in non-gaming apps than in games. While the mobile gaming market remains a powerhouse at $98 billion in annual revenue, it is maturing toward fewer, higher-spending players. In contrast, non-gaming sectors like utility, health, and finance are seeing aggressive double-digit growth.
Non-gaming apps offer a more stable and predictable ROI because they are built on recurring subscriptions rather than hit-driven gaming cycles. The higher user time and stronger long-term engagement found in utility and SaaS apps provide a stickier ecosystem for sustaining revenue.
4. Finance and Crypto Surge
The financial sector is undergoing a massive mobile-first migration. A staggering surge in demand for specialized finance and crypto platforms highlights a vacancy left by traditional banking institutions. As of this year, approximately 560 million people globally own at least one cryptocurrency, representing nearly 10% of the connected population. This growth is fueled by:
- Institutional Adoption: US spot Bitcoin ETFs have accumulated over $128 billion in assets under management.
- Mainstream Integration: Tokenized assets and on-chain finance are reducing intermediary costs by up to 40%.
- Automated Wealth Management: AI-driven micro-investing tools are capturing the idle capital of the everyday user.
5. Ecommerce Divergence
The e-commerce landscape is experiencing a divergence between mass-market marketplaces and specialized shopping experiences. While giant platforms dominate download volume, niche marketplaces are winning on engagement. Adobe Analytics reports that mobile devices now account for 47% of all online sales, a figure steadily climbing toward total dominance.
Successful e-commerce platforms now prioritize mobile-first shopping experiences, such as augmented reality try-ons and single-tap biometric payments, which drastically reduce cart abandonment and increase lifetime value.
6. Wellness Sector Growth
With a 15.1% projected CAGR, the wellness category has evolved into a high-margin business. This sector is no longer just about calories and steps. It has expanded into holistic mental health, bio-optimization, and DNA-based nutrition. Modern wellness apps leverage wearable integration to provide real-time health interventions.
The fitness and exercise segment alone is expected to contribute a 34.6% share of this market. The demand is strongest for platforms that offer personalization, privacy, and measurable physical or mental outcomes.
7. Streaming Market Scale
The streaming sector is being redefined by mobile-first consumption. With the global market for streamed content estimated to exceed $670 billion, the focus is on short-form drama and interactive live-streaming. In high-growth corridors, short-drama platforms offering episodes of 60 to 90 seconds are seeing massive download surges.
This reflects a user base that prefers bite-sized, high-intensity content over long-form traditional media. Platforms that can monetize through both ad-supported tiers and micro-transactions for content credits are seeing the highest growth rates.
8. Sports Engagement Platforms
Sports apps have moved beyond simple scoreboards to become second-screen engagement platforms. They are seeing a significant increase in downloads, driven by the integration of real-time fan interaction, social features, and integrated betting. The most successful sports apps are those that create a stadium in your pocket experience.
This includes live community chats, exclusive behind-the-scenes content, and gamified rewards for fan loyalty. The objective is to keep the user engaged before, during, and after the live event.
9. Universal AI Integration
AI is no longer a standalone category. It is the fundamental layer for all successful apps. We are seeing a silent integration where healthcare apps use AI for diagnostics, education apps use it for personalized tutoring, and lifestyle apps use it for automated scheduling. This shift transforms simple software into proactive partners that anticipate user needs before a single command is given.
- Healthcare: AI-driven symptom checkers and remote patient monitoring are now standard.
- Education: Adaptive learning paths adjust to a student’s pace in real-time.
- Lifestyle: Intelligent assistants handle logistics, from booking dinner to managing home energy.
Mobile App Revenue Trends: What Actually Drives Profit
Profitability in the mobile apps ecosystem has moved beyond simple transaction volume. The modern revenue landscape is dictated by the ability to capture and retain high-intent users through value-based pricing. Recent data confirms a massive shift in capital allocation, where consumer spending on in-app purchases and subscriptions reached a staggering $41 billion in a single quarter. This surge is largely driven by a migration toward digital services that provide ongoing utility rather than one-off entertainment.
1. Subscriptions and IAPs
The subscription economy has reached a state of maturity where it is no longer just an option but the primary expectation for premium digital services. Consumer behavior has shifted toward the utility-as-a-service model, where users are comfortable with recurring payments in exchange for continuous updates, cloud synchronization, and AI-driven features. YouTube provides a prime example of this success, with its premium subscription service helping the app generate over $1.2 billion in annual consumer spend.
The strength of this model lies in its predictability:
- Compounding Revenue: Unlike one-time purchases, subscriptions create a baseline of monthly recurring revenue (MRR) that allows for aggressive reinvestment.
- Lower Churn via Inertia: Once a user integrates an app into their workflow, the friction of switching often outweighs the cost of the subscription.
- Tiered Access: IAPs (In-App Purchases) provide a secondary layer of monetization, allowing power users to top up their experience without forcing a higher tier on casual users.
2. Non-Gaming Revenue Growth
Historically, gaming was the undisputed king of mobile revenue. However, the gap is closing with remarkable speed. While gaming revenue has faced stagnation due to market saturation and high user acquisition costs, non-gaming categories are seeing double-digit year-over-year growth.
According to Sensor Tower, non-gaming apps now account for over 50% of total consumer spend on the App Store, a historic shift in market dynamics. Tinder remains a powerhouse in this category, consistently ranking at the top of non-gaming charts with annual revenues exceeding $1.9 billion.
Non-gaming apps offer a more stable and predictable ROI because they are built on recurring subscriptions rather than hit-driven gaming cycles. The higher user time and stronger long-term engagement found in utility, health, and finance apps provide a stickier ecosystem for sustaining revenue.
3. Conversion and Pricing
Converting a free user into a paying customer is a science of psychology and timing. In the current market, the most successful platforms utilize a high-transparency funnel. Users are increasingly wary of hidden fees, making clear communication of value essential for conversion. Duolingo has mastered this conversion science, utilizing gamified streaks and clear premium value propositions to drive over $500 million in annual booking revenue.
- Longer Trial Periods: Moving from 3-day to 14-day trials has shown to increase long-term retention by allowing the app to become a daily habit.
- Decoy Pricing: Utilizing a three-tier pricing strategy nudges users toward the middle tier, which usually offers the best margin for the developer.
- Predictive Personalization: AI-driven systems now trigger discount offers specifically when a user shows signs of dropping off, saving the conversion before it is lost.
4. Hybrid Models and iOS
The most resilient platforms do not rely on a single revenue stream. Hybrid monetization of combining subscriptions, targeted advertising, and micro-transactions, allows a platform to monetize 100% of its user base. This approach balances steady subscription income with the high-margin upside of digital goods.
LinkedIn exemplifies this by blending premium subscriptions with a robust B2B advertising engine, contributing to billions in mobile-driven revenue.
| Platform | Revenue Share | Growth Driver |
| iOS (App Store) | ~65% | Higher purchasing power and subscription-ready user base |
| Android (Play Store) | ~35% | Volume-led growth and ad-supported models |
Despite Android’s massive global market share, iOS continues to dominate the revenue charts. This is due to a demographic that demonstrates a significantly higher propensity to pay and a more streamlined biometric payment ecosystem. For any platform looking to capture maximum profit, a premium-first launch on iOS remains the industry standard, while Android serves as the primary engine for global reach.
Top Mobile App Development Trends in 2026
The velocity of innovation in the mobile app sector has reached an unprecedented pace. Development is no longer just about creating a functional interface. It is about building intelligent ecosystems that are deeply integrated with the physical world and the user’s personal context.
Modern architecture for mobile apps must now prioritize low-latency connectivity, proactive intelligence, and hyper-secure frameworks to remain competitive in a market.
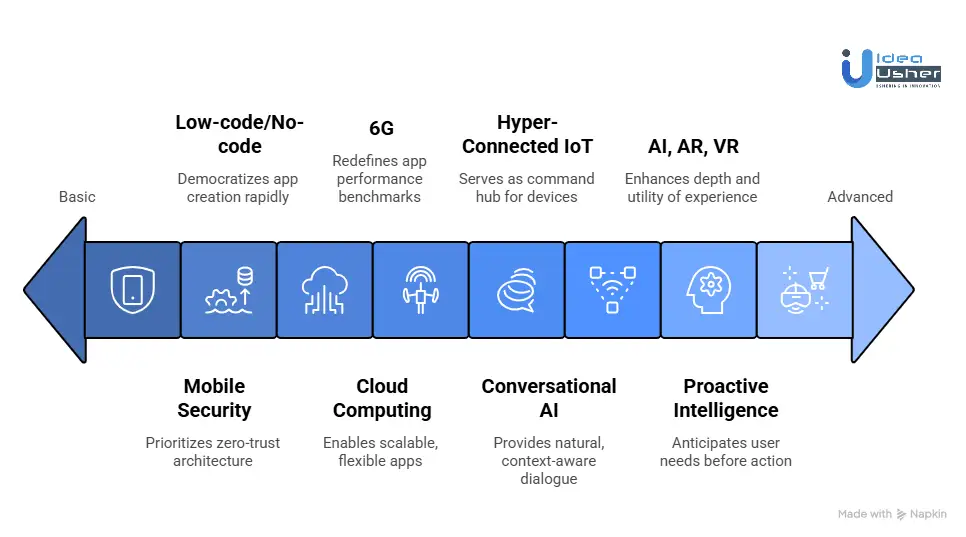
1. 6G and the Connectivity Revolution
While 5G continues to expand, the foundations for 6G Technology are already redefining app performance benchmarks. With projected speeds reaching up to 1 Tbps, the shift toward 6G allows for near-instant data exchange. Current market analysis values the global 6G market at $780 million this year, as infrastructure begins to move from research labs to early-stage deployment.
- Real-Time Synergy: Apps can now offload heavy computational tasks to the cloud without any perceptible lag. This allows for smaller app sizes and faster load times.
- Holographic Communication: 6G provides the bandwidth required for real-time 3D holographic calls and advanced telepresence. This moves video conferencing beyond the screen and into a spatial experience.
2. The Hyper-Connected IoT
IoT integration has evolved from basic remote controls to complex, automated workflows. Mobile apps now serve as the central command hub for an array of smart devices, from medical wearables to industrial machinery. The global shipment of wearables alone is expected to surpass 600 million units by the end of next year, fueling the need for apps that can manage high-density data from multiple sensors simultaneously.
3. Proactive Intelligence and Analytics
Predictive Analytics has transformed apps from reactive tools into proactive assistants. By leveraging machine learning and behavioral data, apps can now anticipate user needs before an action is even taken. The global predictive analytics market is on track to reach $28.1 billion this year, reflecting a massive investment in software that can analyze biometric or financial trends in real time.
- Financial Services: Predicting spending patterns and automatically flagging potential budget overages.
- Health Tech: Analyzing biometric trends to alert users to potential health risks before symptoms manifest.
- Retail: Building dynamic shopping feeds that adjust based on real-time inventory and historical preference.
4. Cloud Computing Integration
Cloud-native development is now a baseline requirement. Integrating cloud computing allows developers to build scalable, flexible apps that can handle massive data loads without compromising device performance. The cloud-based app market is currently valued at approximately $575 billion, highlighting the shift toward server-side processing for complex mobile tasks.
5. Advanced Conversational AI
The era of rule-based Chatbots is over. Modern interfaces utilize Large Language Models and generative AI to provide natural, context-aware dialogue. These assistants handle complex multi-step tasks with a level of nuance that mirrors human interaction. Recent projections suggest that 91% of companies with over 50 employees now use AI bots to handle at least one part of their customer journey.
6. Efficiency in Development
The rise of Low-code / No-code Development is democratizing app creation. The global market for these platforms is expected to grow to $66.2 billion this year as enterprises utilize them to rapidly deploy internal tools and MVPs. This allows professional developers to focus on high-complexity logic and core product innovation.
7. Foundational Mobile Security
As apps handle more sensitive data, Mobile App Security has shifted to a Zero-Trust architecture. Security is no longer an add-on. It is a foundational element of the development lifecycle. The mobile application security market has surged to $10.36 billion this year, driven by a 22.8% annual growth rate in response to increasingly sophisticated cyber threats.
- Behavioral Biometrics: Analyzing typing rhythm and gesture pressure to detect unauthorized access in real time.
- Quantum Encryption: Implementing next-generation encryption standards to protect data against emerging cyber threats.
8. Apps for Foldable Devices
Foldable and dual-screen hardware has moved from niche to mainstream. This requires a shift in UI/UX design toward App Continuity. Global foldable smartphone shipments are projected to grow by 20% this year, particularly as new flagship entries intensify competition in the premium segment.
| Feature | Benefit |
| Multi-Window Support | Allows users to run multiple apps or views simultaneously. |
| Responsive Layouts | Interfaces transition seamlessly from a phone screen to a tablet-sized display. |
| Ergonomic Controls | Interactive elements account for different folding angles. |
9. The Ubiquity of AI, AR, and VR
Artificial Intelligence is now the engine behind almost every modern app feature. Combined with Augmented Reality and Virtual Reality, mobile devices are becoming windows into spatial computing environments. Revenue in the AI-integrated AR and VR market is projected to reach $122.48 billion this year, a 46% increase reflecting the rapid adoption of immersive content.
In retail, AR allows for high-fidelity virtual try-ons. In healthcare, VR facilitates immersive medical training and remote surgical simulations. These technologies are no longer separate categories. They are integrated layers that enhance the depth and utility of the mobile experience.
User Retention Statistics In Mobile App Industry
Here are some insights on user trends and preferences that affect retention rates for mobile apps:
- App size plays a crucial role in user retention, with 50.6% of users uninstalling apps that take up too much memory on their phones.
- The churn rate of app users after three months is 71%, indicating that almost three-fourths of app users worldwide stop engaging with or uninstall an app within three months of downloading it.
- App crashes or other major errors lead to a 62% uninstall rate, which negatively affects retention and leads to negative reviews.
- Slow loading or downloading times are a significant factor in app abandonment, with 25% of users abandoning apps due to long loading times.
- E-commerce & Retail apps have the highest retention rate after 30 days, at 39%, as most users find these apps useful over a long period.
- Conversely, Social Networking apps have the lowest retention rate after 30 days, which may be surprising given the popularity of major social media sites. However, many smaller social media apps see high churn rates.
- Travel & Lifestyle apps have the highest retention rate after 90 days, with 23% of users still engaged. On the other hand, Social Networking apps have the lowest retention rate, with only 16% of users sticking around after 90 days.
- Almost half (47%) of apps require more testing before release. Many apps are not adequately prepared to meet user demands, whether for bugs or security issues. Shockingly, 75% of mobile applications fail basic security tests.
- Despite the benefits of mobile app marketing, only 54% of marketers use apps to reach their customers. This is surprising because half of the users discover new products and companies through mobile apps.
According to a report by Business of Apps,
- After conducting global research, it was found that the average retention rate across 31 mobile app categories was 25.3% on the first day but declined sharply to 5.7% by Day 30.
- On iOS devices, the average retention rate on Day 1 was 25.65%, which fell to 4.13% on Day 30. Similarly, on Android devices, the average retention rate on Day 1 was 23.01%, which decreased to 2.59% on Day 30. A good DAU/MAU ratio is around 20%, while anything above 25% is considered exceptional.
- It was also discovered that the average app loses 77% of its daily active users (DAUs) within the first three days after installation. Furthermore, the average Month 1+ churn rate was found to be 55%, while the Month 3+ churn rate was 68%.
- Effective implementation of in-app messages has been proven to boost retention by 30%. Additionally, owned media (push notifications, email, SMS) had Day 30 retention rates that were 30% higher in 2021 compared to user acquisition campaigns.
- Finally, the research showed that app users who engage with an app at least once a week are 90% more likely to become long-term users.
1. Retention Rate Of Different Types Of Mobile Apps:
The following table shows the retention rates for various types of mobile apps over a period of 30, 60, and 90 days:
| Type of Mobile App | 30-Day Retention Rate | 60-Day Retention Rate | 90-Day Retention Rate |
| Media & Entertainment | 37% | 27% | 22% |
| E-commerce & Retail | 39% | 27% | 22% |
| Travel & Lifestyle | 38% | 28% | 23% |
| Business & Technology | 34% | 23% | 17% |
| Social Networking | 30% | 20% | 16% |
Statistics For App Types
- Communication apps are the most frequently used type of app, with 50% of app users mainly using them for messaging and social media. Social media apps alone are the most frequently used type of app for 40% of smartphone owners, while messaging apps are the most frequently used for 10% of them.
- Gaming apps generate the most revenue, accounting for 67.36% of all app revenue in 2021. They generated $37.3 billion on the Google Play Store and $52.3 billion on iOS, while all other non-gaming apps generated only $43.4 billion.
- As of 2021, 79% of smartphone users have made a purchase using their mobile devices. This is unsurprising, considering the average mobile purchase is $94.85.
- There are over 700,000 educational apps available on the market. In fact, as of 2021, 470 million educational apps have been downloaded from the Apple App Store alone.
- Gaming apps are the most popular category on the Apple App Store, making up 21.07% of all available apps. This is followed by business apps (10.7%), education (8.66%), lifestyle (8.58%), and utility apps (6.39%).
- 62% of people have a gaming app installed on their phone, and games account for 43% of all smartphone users.
- 66.5% of smartphone owners use and rely on map apps, with Google Maps being the preferred map app for 77% of those users.
1. Distribution Of Free And Paid Apps
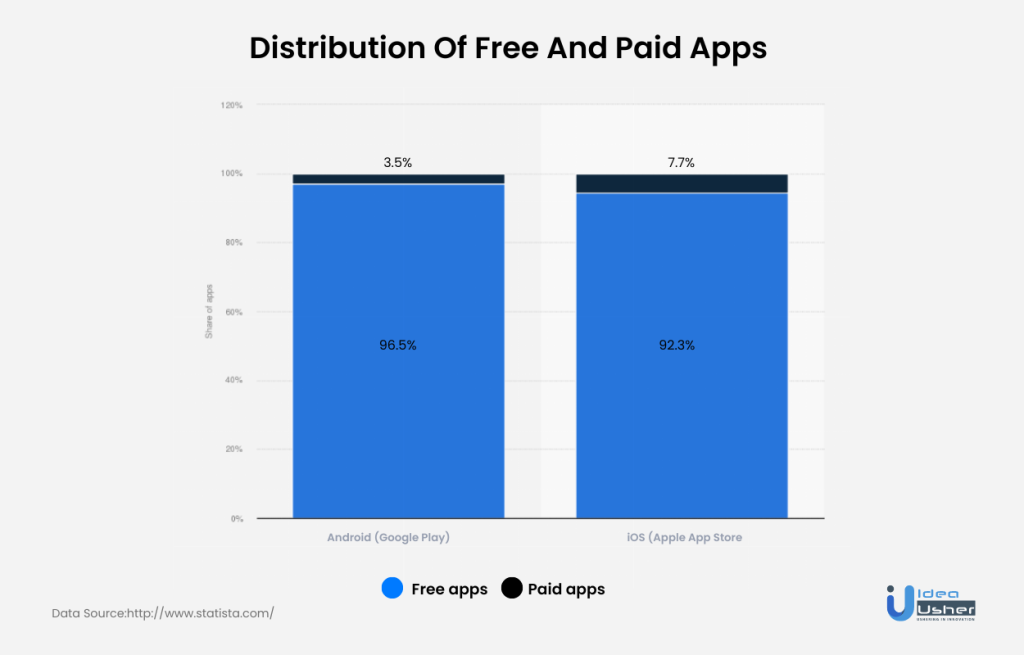
- In March 2023, 97% of apps in the Google Play store were free, with free apps being consistently more popular than paid ones.
- In Q4 2022, global consumer spending on mobile apps totaled nearly $70 billion.
- As of Q3 2022, consumers spent an average of $4.86 on mobile apps per smartphone.
- Apple and Google have faced criticism for their app store commission rates, which were set at 30% as of July 2022.
- In response to this criticism, Apple and Google have changed their app store policies, such as reducing commission fees for smaller publishers and allowing alternative payment methods.
- Microsoft is reportedly preparing to launch a new mobile gaming store to compete with the Apple App Store and Google Play Store.
- Mobile app spending is projected to reach $161 billion on the Apple App Store and $72 billion on Google Play Store by 2026.
Popular Apps Statistics
- In 2022, TikTok surpassed all other mobile apps with a whopping 672 million downloads worldwide.
- Subway Surfers topped the list of most downloaded games in 2022, with a total of 304 million downloads.
- Four of the ten most downloaded apps of 2021 were developed and published by Meta, formerly known as Facebook.
1. Most Popular Apps
In 2022, TikTok maintained its position as the most popularly downloaded app, while its video editing application CapCut was ranked in the top five. Interestingly, Facebook dominated with three apps in the full five downloaded applications list. Source: Apptopia
| App | No. of Downloads in Million (Global) |
| Spotify | 238 |
| Stumble Guys | 254 |
| Subway Surfers | 304 |
| Telegram | 310 |
| Snapchat | 330 |
| CapCut | 357 |
| 424 | |
| 449 | |
| 548 | |
| TikTok | 672 |
In the US, TikTok managed to maintain its status as the most downloaded app for two consecutive years, with an increase in its downloads. Furthermore, Cash App witnessed another rise in popularity in 2022, thereby solidifying its position as the top financial app in the US. Source: Apptopia
| App | No. of Downloads in Million (US) |
| 45.5 | |
| Messenger | 46.3 |
| Amazon | 47 |
| Roblox | 50.9 |
| Subway Surfers | 51.4 |
| Snapchat | 54 |
| 63 | |
| Cash App | 64 |
| 72 | |
| TikTok | 99 |
Google Play Store vs. Apple App Store Statistics In Mobile App Industry
1. Quality (Approval Time):
- The Google Play Store typically takes approximately two hours or less to assess and authorize an app for public use.
- Automated verification procedures are in place to ascertain the absence of malware, viruses, or copyrighted content, and experts also conduct manual checks.
- Conversely, the Apple App Store is more thorough in app reviews before publishing. More than 90% of iOS apps are examined within 48 hours of submission.
- Therefore, it can be inferred that the Apple App Store offers superior-quality apps than Google Play, which has a higher probability of security risks.
2. Revenue:
- Both Google Play Store and Apple App Store share revenue with developers at a 70-30 split in favor of the developer.
- In 2021, the Apple App Store generated $85.1 billion in estimated revenue, while Google Play Store generated nearly $47.9 billion, a 24% increase from the previous year.
- Apple App Store outperforms Google Play in revenue, despite Android holding a 71% mobile and tablet operating system market share worldwide, compared to iOS’s 28.37%.
- As of August 2022, Apple’s market cap is $2.66 trillion, making it the world’s most valuable company.
- As per StatCounter, as of January 2023, Android OS dominates the mobile operating system market with a 71.77% share, although Android’s market share has slightly decreased from around 75%, while iOS’s market share has increased from 23% in 2019 to 27.03% in 2022.
3. Number Of Apps:
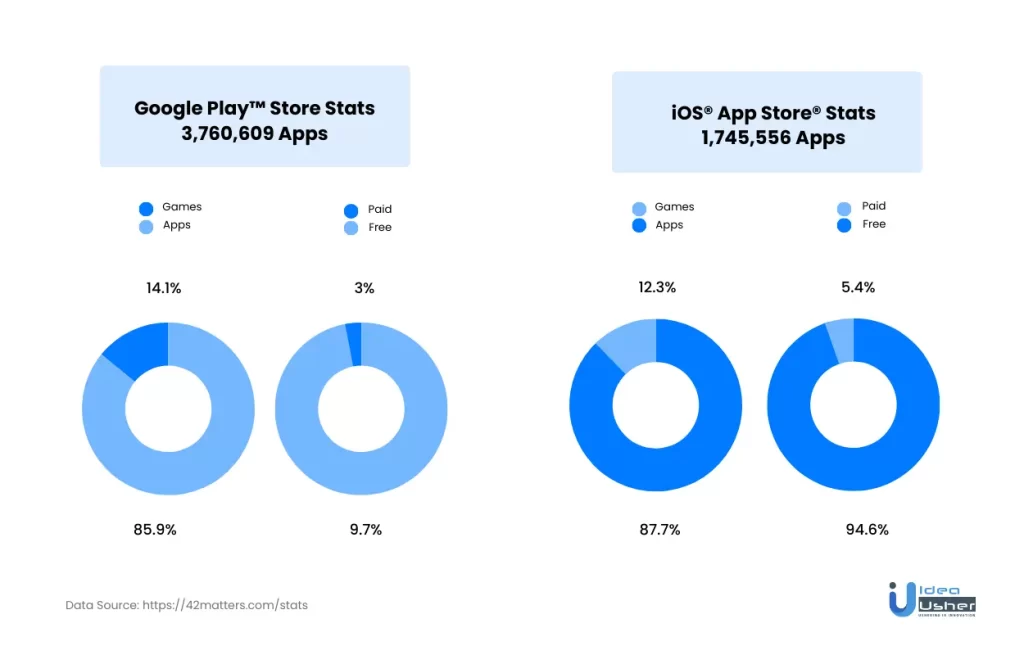
- The Apple App Store started with 500 iOS apps and has now grown to include 2.18 million apps as of Q1 2022.
- The Google Play Store is the largest app store, with 3.5 million Android apps as of Q2 2022. In 2021, 111.3 billion mobile apps were downloaded from Google Play worldwide, and it’s projected to increase to 139 billion mobile apps by 2025.
- Google Play Store has a larger number of apps compared to the Apple App Store.
Mobile App Strategies Businesses Need to Win This Year
Winning in the current mobile ecosystem requires shifting from a download-first mindset to a value-first reality. With the global mobile application market projected to hit $373 billion this year, the competition is no longer just for space on a screen. It is for a permanent place in a user’s cognitive routine. Successful ventures now prioritize capital efficiency and technical resilience. The strategy is simple. Build smarter, launch faster, and protect the user at all costs.
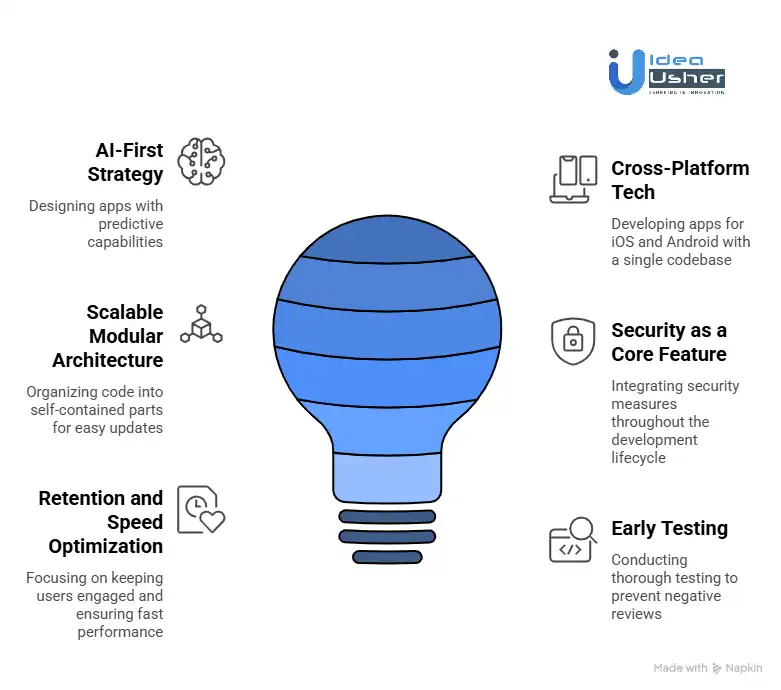
1. Build an AI-First Strategy
Artificial intelligence is no longer an optional feature. It is the core foundation of modern mobile apps design. An AI-first approach means designing with predictive capabilities from day one rather than patching them in later. Generative AI apps saw a 273% year-over-year revenue increase in recent cycles, proving that users are now willing to pay for automated workflows. Otter.ai serves as a strong example of this shift, leveraging AI-first transcription and meeting summaries to reach millions in revenue by solving a specific productivity pain point.
- Predictive Intent: Move beyond static dashboards. Use AI to anticipate what a user wants to do next.
- Hyper-Personalization: Market data shows that 61% of consumers now expect deep personalization as a baseline requirement.
- Outcome Tracking: Replace generic session tracking with Task-to-Value metrics. Success is measured by how quickly the AI helps the user finish a job.
2. Use Cross-Platform Tech
Speed to market is a primary competitive advantage. Cross-platform frameworks like Flutter and React Native have matured to the point where they can reduce development effort by up to 80% without sacrificing performance. Flutter currently leads the market with a 46% developer adoption rate, allowing businesses to capture both iOS and Android audiences simultaneously with a single codebase.
Reface successfully utilized this strategy to scale its viral AI face-swap technology across both platforms rapidly, reaching over 100 million downloads.
Efficiency Note: Choosing a single-codebase approach can accelerate delivery timelines by nearly 40%. For a business, this means lower initial burn rates and the ability to pivot based on real user feedback twice as fast as native-only competitors.
3. Design Scalable Modular Architecture
Modularization is the practice of organizing a codebase into loosely coupled, self-contained parts. In a market where apps must evolve weekly, a monolithic codebase is a liability. A modular structure allows different teams to work on different features without breaking the entire system.
| Benefit | Impact on Business |
| Code Reusability | Build multiple apps or white-label versions from the same foundation. |
| Faster Build Times | Incremental builds allow for quicker testing and deployment cycles. |
| Easier Ownership | Assign specific modules to dedicated teams to improve quality. |
4. Make Security a Core Feature
The mobile app security market is growing at a 22.8% annual rate as cyber threats become more sophisticated. Security cannot be a final check before launch. It must be baked into the development lifecycle. Zero-Trust architecture is now the standard, ensuring that every request is verified regardless of its origin.
- Behavioral Biometrics: Implement systems that analyze gesture pressure and typing rhythm to detect unauthorized users.
- Risk Intelligence: Evaluation tools now allow businesses to mitigate compliance risks associated with third-party integrations in real time.
- Data Governance: With stricter global regulations, proactive data protection is a requirement for maintaining brand trust.
5. Optimize for Retention and Speed
Downloads mean nothing if users leave after the first day. The median day-30 retention rate across all categories remains stubbornly low, often hovering around 4%. Increasing your retention rate by just 5% can drive up profits significantly over time, as long-term users are far more likely to convert into high-value brand advocates.
- The 2-Second Rule: Users expect apps to load and respond instantly. Every millisecond of delay correlates directly with a drop in conversion.
- Progressive Onboarding: Don’t force a tutorial. Let users learn by doing to reach their first value event in under 60 seconds.
- Smart Nudges: Users who receive a single, relevant push notification in their first 90 days are three times more likely to stay active.
6. Prioritize Early Testing
Early-stage performance testing is the best defense against a 1-star review. Moving from a three-star to a four-star rating can increase conversion rates by 89%. Testing should not just focus on whether the app works, but how it works across different device tiers and network conditions.
Effective testing strategies now include Segmented Observability, where performance signals are broken down by device class and network quality. This ensures that the app provides a reliable experience for the billions of smartphone users worldwide, regardless of their hardware.
Future of Mobile Apps: Where the Market Is Heading
The digital horizon is shifting from a screen-centric world to an ambient one. We are entering an era where the smartphone is no longer just a handheld computer. It is a portal into an integrated digital layer of reality. Modern mobile apps are the primary catalyst for this transition, evolving from standalone tools into proactive, invisible assistants that live within our environment.
1. App Spend vs. Gaming
For the first time in mobile history, the crown of consumer spending is changing hands. While mobile gaming has historically been the primary revenue driver, non-gaming apps are now projected to capture over 50% of global consumer spend by the end of the decade. Recent data indicates that in-app spending through non-gaming stores will reach $288 billion annually by 2030, marking a 267% increase from the previous decade.
This flip is driven by a massive surge in utility and entertainment subscriptions. Platforms like TikTok and Disney+ have proven that users are willing to pay for continuous value rather than just one-off digital skins. While gaming revenue remains a powerhouse, its growth is stabilizing as non-gaming categories race ahead.
| Market Segment | Growth Projection | Primary Driver |
| Non-Gaming Apps | 50.3% Market Share | Subscription-based utility and OTT |
| Mobile Gaming | 49.7% Market Share | Maturing market and in-app purchases |
| Total Decade Spend | $2.2 Trillion | Global digital transformation |
2. AI, AR, and Voice
The way we interact with our devices is undergoing a structural renovation. The old paradigm of tapping on grids of icons is being replaced by a more fluid, immersive experience. Research suggests that 75% of mobile users now expect AI-driven features, such as smart recommendations and predictive interfaces, as a standard.
- Augmented Reality: AR is moving from social filters to high-utility tools in healthcare and retail. With the mobile AR market expected to grow from $30.6 billion to over $113 billion in the coming years, trying before buying via digital overlays is becoming the standard expectation for shoppers.
- Artificial Intelligence: AI is evolving from a feature to the operating system itself. Expect apps to move from reactive to predictive, using biometric data to solve problems before you even ask.
- Voice Interactivity: With a staggering CAGR of nearly 30%, voice is set to become a primary interface. It facilitates natural interaction between devices and humans, resolving queries in real time.
3. Voice and AR Growth
The scale of adoption for these technologies is no longer speculative. By the end of the forecast period, the global voice assistant market is projected to generate over $26.8 billion. This reflects a transition toward conversational commerce and hands-free operation in enterprise and healthcare settings.
Market Insight: The healthcare segment of the AR market is anticipated to grow with a CAGR of 35%. This is driven by an increasing number of medical centers using mobile AR tools for diagnosis and remote surgery guidance.
4. Replacing vs. Reshaping
The most debated question in development is whether the App Age is coming to an end. We are seeing a fundamental shift toward app consolidation via AI agents. Instead of navigating through multiple screens, users are increasingly speaking or typing their intent and expecting immediate results.
The Convergence Scenario:
Instead of having fifteen separate apps for parking, dining, and travel, users will interact with a single on-device AI agent. This agent acts as a middle-layer, communicating with various services via APIs to perform tasks. In this future, the traditional app might disappear from your home screen, but the services they provide will become more deeply embedded in your daily life than ever. Apps are not necessarily dying. They are becoming the invisible engine behind the AI interface.
Why Choose Idea Usher For Mobile App Development?
Navigating the complexities of the digital market requires a partner that blends technical mastery with strategic foresight. At Idea Usher, we do not just build mobile apps. We engineer scalable digital assets designed to dominate their respective niches. Our foundation is built on deep technical expertise and a relentless focus on delivering high-ROI products.
Scalable Engineering
With over 500,000 hours of coding experience our team of ex-MAANG/FAANG developers brings a level of technical rigor rarely found in standard agencies. We utilize a modular architecture and clean-code principles to ensure your app can scale from its first thousand users to its first million without requiring a total rebuild.
This elite engineering background allows us to implement complex features like AI-driven personalization and high-frequency transaction engines with the stability and performance of a world-class tech giant.
Risk-Reducing Strategy
A great app starts long before the first line of code is written. Our strategy-first approach is designed to minimize your development risk by validating market demand and technical feasibility early in the process. This meticulous planning ensures that every dollar of your investment is channeled into a product that users truly need and desire.
- Agile Iteration: We utilize rapid prototyping and phased rollouts to test core assumptions with real users. This ensures your budget is spent on features that actually drive engagement.
- Tech Stack Optimization: We select frameworks based on your specific business goals. This includes the lightning-fast performance of native builds or the cost-efficiency of cross-platform solutions.
- Predictive Roadmapping: Our team identifies potential bottlenecks in security and scalability during the blueprint phase. This prevents costly mid-project pivots.
End-to-End Growth
Our commitment to your success extends far beyond the initial launch. We provide a comprehensive ecosystem of support that covers the entire product lifecycle. This dedicated partnership ensures your platform remains agile and continues to evolve alongside shifting user behaviors and emerging technical standards.
The Idea Usher Advantage: Our clients benefit from a holistic growth framework that includes integrated analytics, proactive security monitoring, and App Store Optimization. This ensures that your application not only functions flawlessly but also maintains a competitive edge in user acquisition and long-term retention.
Conclusion
The mobile app industry is expanding at a fast pace, and the trend is expected to continue. As consumers increasingly use their smartphones for various activities, from shopping to entertainment, businesses can take advantage of this trend to reach their target market. In light of advancing technology, the mobile app industry will keep changing, creating new opportunities for companies to improve their business strategies and stay competitive. By adopting the right approach and being informed about industry insights, businesses can leverage the evolving mobile app industry to their advantage. This will enable them to remain ahead of their competitors while providing value to their customers.
FAQ
Q. How big is the mobile application market?
A. In 2022, the size of the worldwide mobile app market was worth USD 206.85 billion, and experts project it to grow at a compound annual growth rate (CAGR) of 13.8% between 2023 to 2030.
Q. Which companies are major players in the mobile application market?
A. Several prominent companies in the mobile application market are Apple Inc., Google LLC, Microsoft Corporation, Amazon Inc., and Gameloft SE.
Q. What is the mobile application industry?
A. The mobile app industry pertains to a specific area of the software industry that specializes in creating and delivering mobile applications intended for use on mobile devices such as tablets and smartphones. It provides a range of applications spanning various categories, such as gaming, healthcare, fitness, music, entertainment, e-commerce, and retail, among others.
Q. Is the mobile app industry competitive?
A. Regardless of the size and growth of the market, the mobile application industry is highly competitive and challenging. While it may be relatively easy to enter the market, sustaining a successful presentation is a major concern for entrepreneurs.
Q. What are the 6 main categories of apps?
A. Here is the six types of mobile apps:
- Educational app
- Lifestyle apps
- Social media apps
- Productivity apps
- Entertainment apps
- Game apps
Q. What are the Top Mobile App Development Trends in 2025?
A. Here are some of the trends to look for in 2023 and beyond:
- Rise of 5G
- Apps for foldable devices
- AR & VR
- Wearable app integration
- Food & grocery delivery apps
- Mobile entertainment & gaming
- AI & Machine Learning
- Super apps
- Mobile commerce
- P2P mobile apps
- Blockchain
- Predictive analytics
- Mobile learning
- IoT-enabled mobile apps