 (+971) 8007 4267
 (+91) 946 340 7140
 (+1) 628 432 4305

As we head into 2025, more businesses are realizing that data-driven marketing isn’t just a trend, it’s the way forward. With powerful analytics tools and AI at their fingertips, companies now have the ability to make smarter decisions that truly connect with customers. Instead of guessing what will work, they can rely on solid data to guide their strategies, tweaking their approach based on real insights.
This approach not only helps them refine their marketing but also proves that every dollar spent is working harder for them, giving them a clearer picture of what’s actually driving results. It’s all about cutting through the noise and making marketing decisions that are backed by real, actionable data.
Over the years, we’ve supported numerous businesses in leveraging quantitative marketing to precisely measure customer engagement, campaign performance, and ROI. IdeaUsher’s expertise has been pivotal in creating automated solutions that continuously track and optimize marketing efforts in real-time. Through this blog, we aim to share our insights, providing you with the tools and strategies to successfully integrate these approaches into your own business. Let’s dive in!
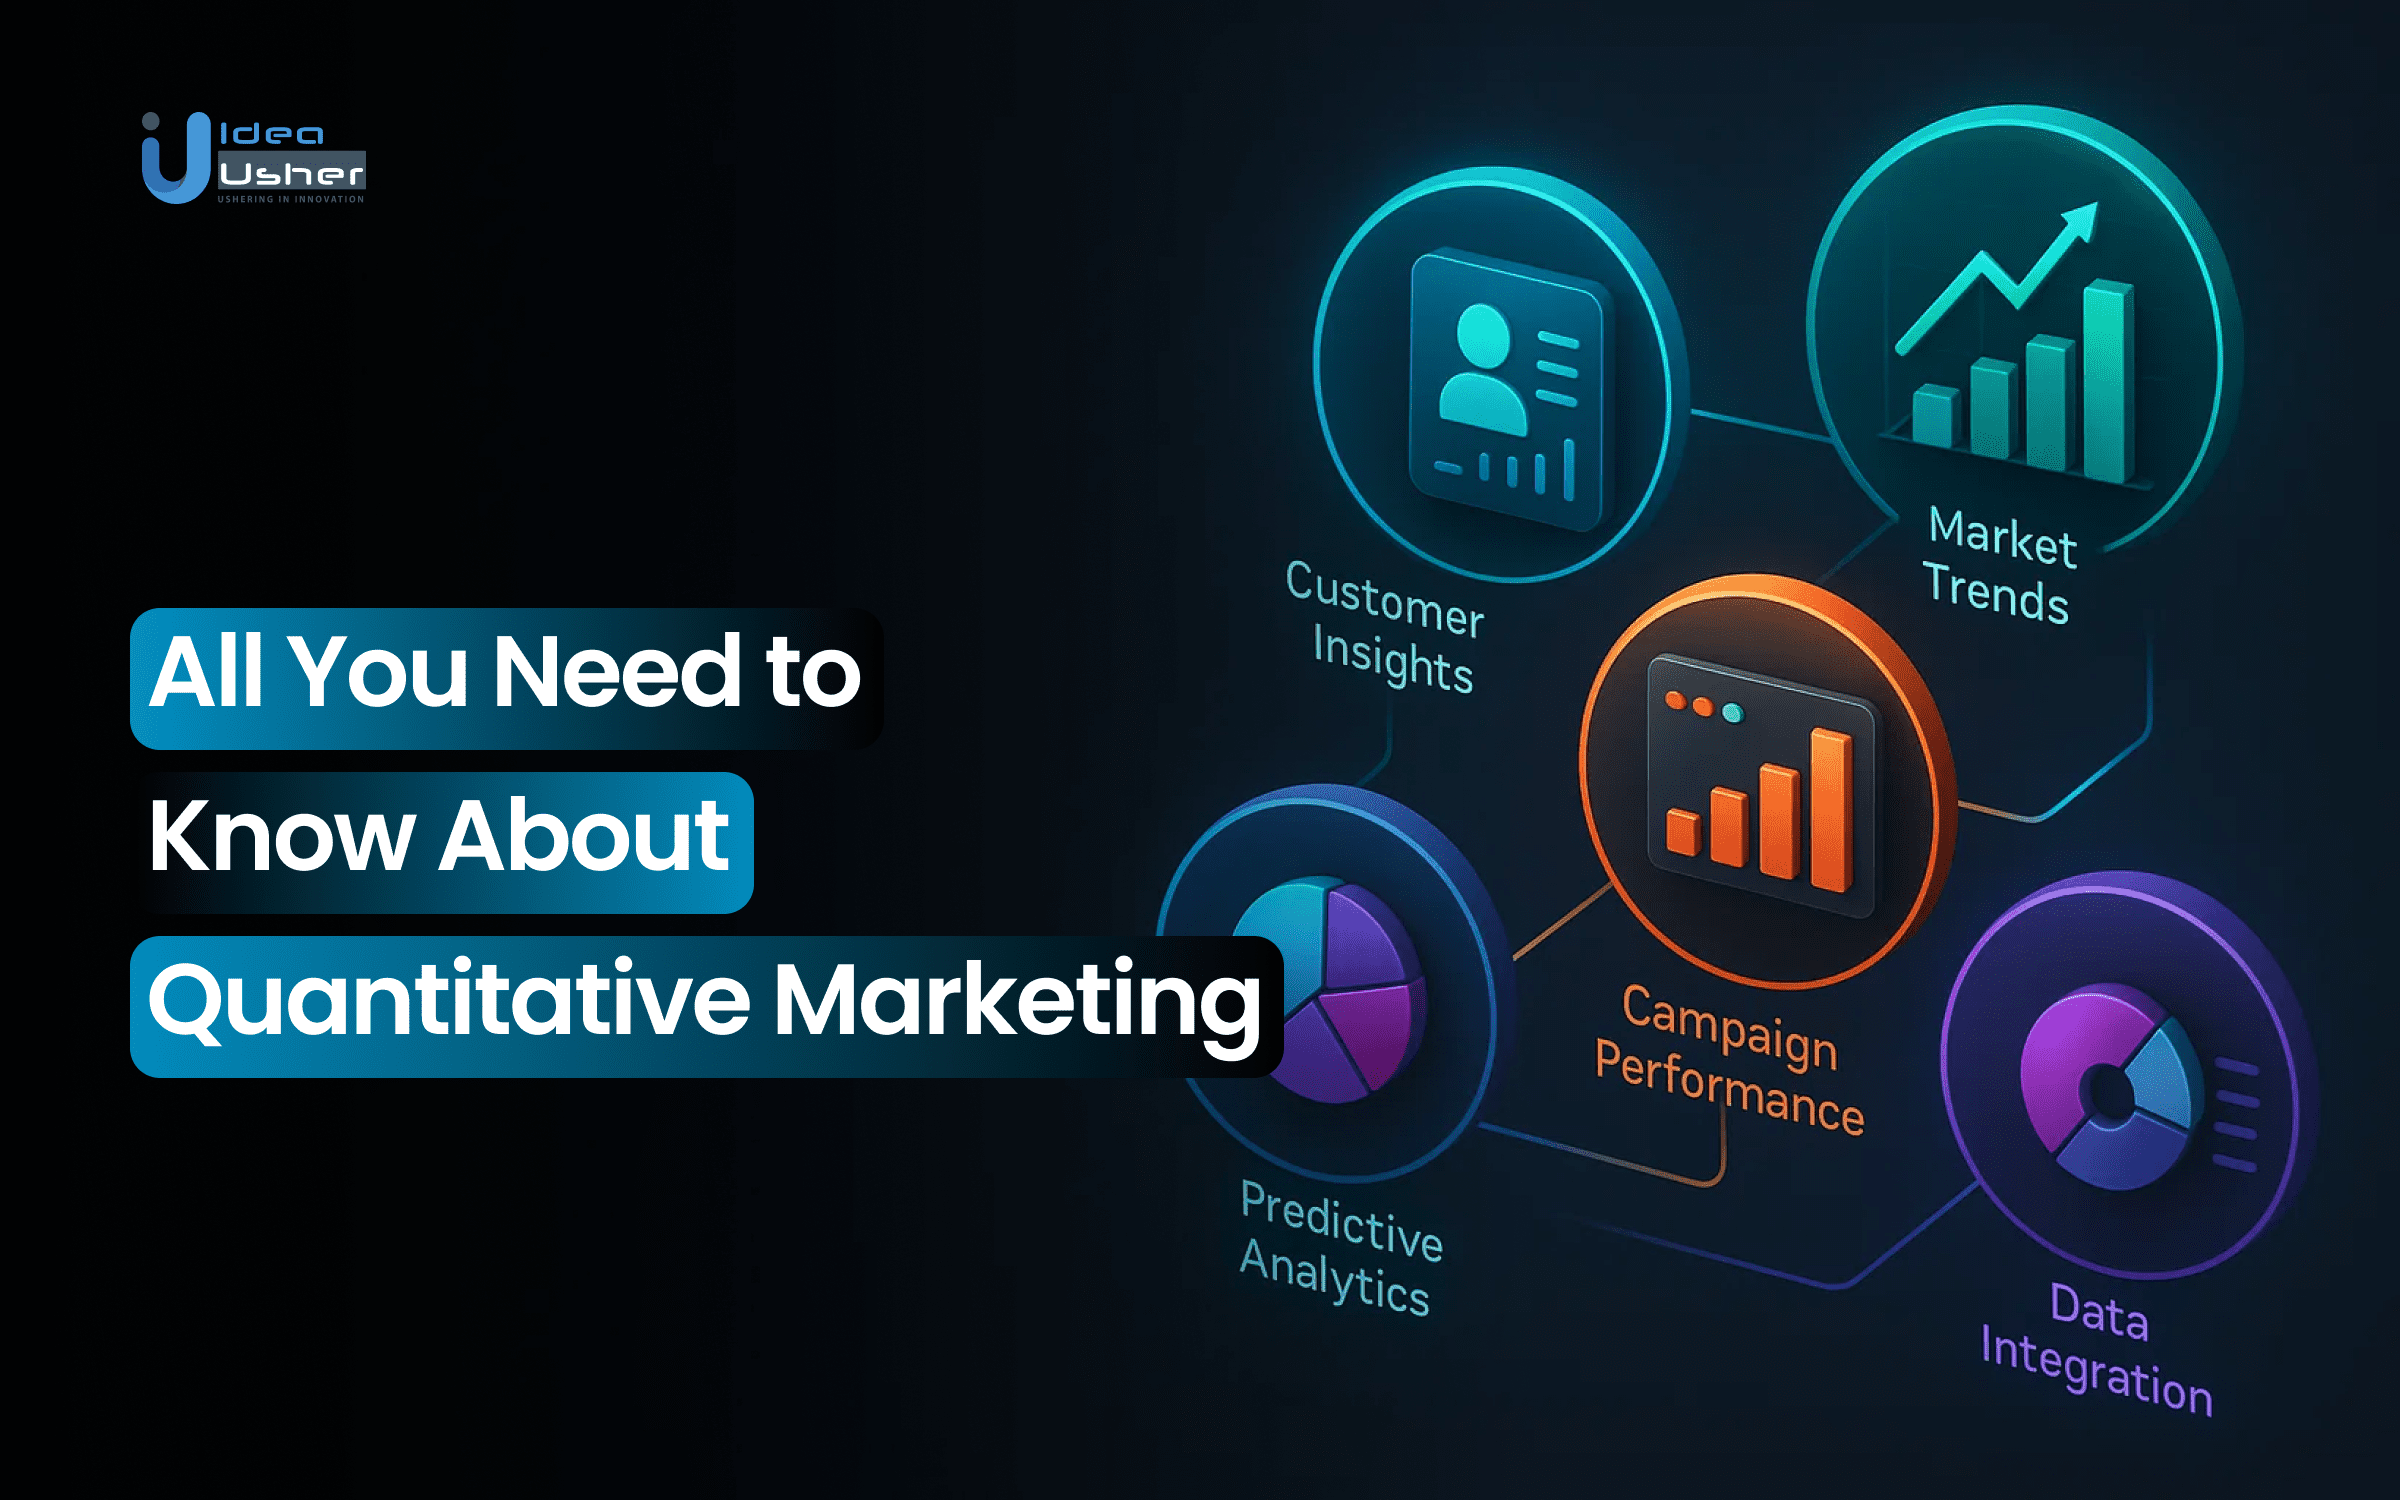
Key Market Takeaways for Quantitative Marketing
According to GrandViewResearch, the marketing technology industry is booming, expected to grow from $465 billion in 2024 to over $1.3 trillion by 2030. This growth reflects the rising role of quantitative marketing, where data-driven strategies are helping businesses stay competitive in an increasingly digital world. Advanced tools like analytics, data mining, and algorithmic decision-making are now essential for refining marketing tactics and achieving better outcomes.

Source: GrandViewResearch
At the core of this shift is the ability to use data to make smarter decisions. Companies can now target the right audiences, optimize their pricing strategies, and create personalized campaigns based on solid evidence. The ability to measure and track results in real-time gives businesses the power to adapt quickly, ensuring their marketing dollars are well spent.
Major global brands, such as McDonald’s, Coca-Cola, and Amazon, are already leveraging quantitative marketing to their advantage. McDonald’s, for instance, uses customer transaction data to improve its product offerings and marketing campaigns. Coca-Cola employs a mix of research methods, from taste tests to social media analysis, to anticipate consumer needs and preferences, showcasing how critical data is in shaping the future of marketing.

What is quantitative marketing?
Quantitative Marketing is a data-driven approach that relies on numerical data, statistical analysis, and mathematical models to assess, manage, and enhance marketing performance. The focus of this methodology is on objectivity, replacing subjective opinions with hard evidence to:
- Accurately measure the impact of marketing initiatives.
- Gain insights into customer behavior at scale.
- Forecast future trends and outcomes.
- Optimize marketing campaigns in real-time for maximum efficiency.
Essentially, Quantitative Marketing is the scientific side of marketing, grounded in facts and figures.
Quantitative vs. Qualitative Marketing
Rather than choosing between quantitative and qualitative methods, the most successful strategies combine both approaches. Think of them as complementary perspectives that provide a more complete understanding of the customer.
| Feature | Quantitative Marketing | Qualitative Marketing |
| Primary Question | What is happening? How much? | Why is it happening? How does it happen? |
| Data Type | Numerical, structured, statistical | Textual, observational, anecdotal |
| Method Examples | A/B Testing, Analytics, Surveys | Interviews, Focus Groups, Reviews |
| Sample Size | Large (100s to 1000s) | Small (5-50) |
| Key Strength | Measurement & Validation: Identifies what works on a large scale. | Discovery & Insight: Reveals motivations and emotions. |
| Output | Charts, graphs, KPIs, ROI metrics, p-values | Quotes, themes, user stories, pain points |
How They Work Together:
Qualitative research generates hypotheses, such as customer interviews suggesting a new feature is needed. Quantitative research then tests these hypotheses on a larger scale, validating if, for example, the new feature increases conversion rates. One method uncovers the why, and the other confirms the what.
Key Types of Quantitative Marketing in Practice
Quantitative marketing isn’t just one technique; it’s a strategic framework applied across various marketing channels.
Market Research Surveys & Questionnaires
Market research surveys use closed-ended questions to collect numerical data, allowing businesses to gain insights on various metrics like customer satisfaction or brand awareness. This approach helps quantify attitudes, opinions, and preferences, making it easier to assess market trends and evaluate potential product demand in different regions.
Web & Behavioral Analytics
Web and behavioral analytics involve tracking user interactions with digital platforms, such as websites or apps. This data reveals patterns in user behavior, such as drop-off points during checkout. By analyzing these trends, marketers can identify friction areas in the user experience, leading to optimizations that improve conversion rates and customer retention.
A/B and Multivariate Testing
A/B and multivariate testing are experimental methods where different versions of a marketing asset are tested to see which performs better based on specific metrics, such as click-through rates or conversions. For example, testing different email subject lines can reveal which generates higher engagement, helping marketers refine their campaigns for optimal performance.
CRM & Sales Pipeline Analysis
CRM and sales pipeline analysis involves using data from customer management systems to evaluate the performance of sales funnels, such as conversion rates and lead velocity. This approach enables businesses to identify which channels are most effective in driving sales, allowing for better resource allocation, like shifting budget toward high-performing webinar-generated leads.
How Quantitative Marketing Works?
Quantitative marketing works by using data to guide decisions and optimize campaigns. It starts with integrating data from different sources, then experiments are run to test hypotheses and measure results. The goal is to use insights from data to predict future trends, improve strategies, and drive revenue growth.
1. Data Integration & Attribution
Modern businesses rely on a variety of platforms like CRMs (Salesforce), advertising tools (Google Ads, LinkedIn), and website analytics (GA4). However, when these systems operate in isolation, they create data silos, which prevent a clear view of the customer journey.
The Solution: Unified Data & Multi-Touch Attribution
The key to overcoming this challenge is integrating data from all these systems into one central repository (e.g., Google BigQuery, Snowflake). This allows businesses to implement Multi-Touch Attribution (MTA), where each touchpoint in the customer journey—whether it’s an ad, email, or blog post—is assigned a value. This reveals the true ROI of every marketing effort, empowering companies to allocate budgets more efficiently and create personalized customer experiences.
2. Experimentation & Hypothesis Testing
Gone are the days of launching campaigns based on gut feelings. In quantitative marketing, every change to a campaign is treated as an experiment to be tested and validated.
- A/B Testing: Compares two versions of a single element (e.g., headline, call-to-action button).
- Multivariate Testing: Examines the effect of several variables at once, such as a combination of headline, image, and button color.
Designing a Hypothesis-Driven Experiment
In quantitative marketing, every experiment begins with a hypothesis.
For example:
“By changing the CTA button from ‘Learn More’ to ‘Get a Free Demo,’ we expect to increase conversion rates by 10% because it is more action-oriented and directly communicates value.”
The process also involves identifying the key performance indicators (KPIs) and ensuring statistical rigor. A robust experiment includes setting the right sample size, determining the p-value for significance, and ensuring results are reliable.
3. Predictive Modeling & Customer Segmentation
Predictive modeling allows marketers to look beyond historical data to forecast future outcomes. Using techniques like logistic regression, random forests, and gradient boosting, companies can predict customer behaviors like churn or identify high-value customer segments.
- Churn Prediction: By analyzing patterns of past customers who left, predictive models can estimate the likelihood that current customers will churn. This allows marketers to take proactive steps to retain high-risk customers.
- Customer Lifetime Value (CLV) Prediction: Predicts the total revenue a customer will generate over their lifetime. This insight helps marketers target high-value customers more effectively.
The Application for Enterprises
With predictive models, businesses can create customer segments like “High-CLV, At-Risk of Churn” and tailor retention campaigns specifically for them, maximizing customer lifetime value and reducing churn.
4. The Role of AI/ML: Moving Beyond Manual Testing
While A/B testing is valuable, it’s often slow and limited in scope. AI and machine learning can automate optimization at a much larger scale and speed.
For example, AI-powered platforms like Google’s Performance Max automatically adjust bids, placements, and creative elements in real time to optimize for the lowest cost per conversion, continuously testing and learning without human intervention.
Other Applications
- Dynamic Product Ads: AI can automatically generate and serve personalized ads based on user behavior.
- Predictive Lead Scoring: AI systems can predict which leads are most likely to convert, allowing sales teams to prioritize efforts.
Limitations & Ethical Considerations
While AI offers impressive advantages, it’s important to remain cautious:
- Algorithmic Bias: AI models can unintentionally perpetuate biases present in training data.
- Black Box Problem: Understanding how AI makes certain decisions can be difficult.
- Ethical Concerns: Over-reliance on algorithms can lead to privacy violations and manipulative practices, so human oversight is essential.
Benefits of Quantitative Marketing for Businesses
Quantitative marketing gives businesses the ability to make data-driven decisions, ensuring resources are spent on strategies with proven success. It helps scale efforts efficiently, measure ROI with clarity, and optimize campaigns in real-time.
1. Data-Backed Decisions
Quantitative marketing removes the guesswork by relying on data to drive decisions, not intuition. With real-time analytics and historical data, businesses can allocate resources to strategies that are already proven to resonate with their audience, reducing waste and improving effectiveness.
2. Unmatched Scalability
Quantitative marketing scales effortlessly by analyzing data from thousands or even millions of users. This allows businesses to confidently apply successful strategies to a broader audience, ensuring consistent and predictable growth as they expand.
3. Measurable ROI
Quantitative marketing provides clear, measurable results by tracking key metrics like CAC, LTV, and MQLs. With this data, businesses can confidently justify their marketing spend, making it easier to defend or increase budgets based on performance.
4. Improved Lead Quality
Through lead scoring and predictive analytics, quantitative marketing helps businesses target and qualify leads more effectively. This means the sales team receives high-quality, sales-ready leads, which increases efficiency and alignment between marketing and sales.
5. Faster Experimentation
The fast-paced nature of quantitative marketing means rapid experimentation with A/B testing. Businesses can quickly refine their campaigns based on data-driven results, ensuring their marketing efforts are always evolving and optimized.

Characteristics of quantitative marketing research
The following are the key characteristics of quantitative marketing research:
- Large sample size: Quantitative research uses a large sample size to gather the data. This sample size is representative of the entire target population.
- Hypothesis: Quantitative research depends upon a hypothesis, and the goal is to prove or disprove the same.
- Dependent on quantitative data: As the name suggests, this research methodology relies on numbers, statistics, or other quantifiable data to draw conclusions.
- Structured: This method follows a structured approach to data collection and analysis.
- Close-ended: The questions are close-ended to facilitate better data analysis and avoid ambiguity.
- Reusable outcome: Researchers can use the results obtained for the prior study of the subsequent research problem.
- Generalization: The outcome can be generalized to the whole population because of the large sample size.
Pros and cons of quantitative marketing
The below tables summarize the key advantages and disadvantages of quantitative research.
| Advantages | |
| Produces quantitatively rational theories | The outcomes of quantitative marketing are numerical, which enables organizations to make well-thought decisions. |
| Easily analyzable data | Researchers receive exact responses in quantitative research, making evaluating the data more accessible. |
| Respondents participation | The questions in this type of research are close-ended and specific, and quick to answer. Thus, there are high chances of respondents’ participation. |
| Cheaper brand awareness | Quantitative market research is also a way to create brand awareness through online mediums. This method is way cheaper than other modes of promotion. |
| Disadvantages | |
| Limited | Although quantitative research gathers data from a large group, it doesn’t provide the reasoning behind that data. Thus, the interpretation is limited. |
| Structured | The limited opportunity to deviate from a structured answer is both a strength and a weakness of quantitative market research questions. While this provides valuable data, the questions do not allow for validation because of how the survey is designed. |
| Sampling error | There is a chance that the respondents who participate in the survey may not be representative of the entire population. Thus, there is a sampling error risk. |
| It might not be trustworthy. | Sometimes, the respondents are not willing to give out too much information. They might also provide incorrect data leading to false outcomes in the research. |
Step-by-Step Process of Implementing Quantitative Marketing
We implement quantitative marketing for our clients with a structured, data-driven approach that ensures measurable results and continuous growth. We focus on harnessing the power of data at every stage, from gathering insights to optimizing campaigns, creating a strategy that’s both scalable and impactful. Here’s how we do it:
1. Data Collection
We start by gathering a variety of relevant data from multiple touchpoints—surveys, web analytics, customer data, and transactional information. This comprehensive data set serves as the backbone for all our strategies, ensuring we make decisions based on real, actionable insights.
2. Data Integration
Next, we integrate all the collected data from CRM systems, advertising platforms, social media, and website analytics into a single, unified dashboard. This centralized view gives us a clear picture of your customer’s journey and allows us to make informed, cohesive decisions across all channels.
3. Analysis & Modeling
Once the data is integrated, we dive into detailed analysis using descriptive, inferential, and predictive analytics. By understanding past behavior, identifying emerging trends, and forecasting future outcomes, we’re able to develop strategies that are both reactive and proactive, ensuring that your marketing always stays one step ahead.
4. Strategy Development
We take the insights derived from our analysis and translate them into actionable marketing strategies. Whether it’s optimizing ad spend, improving customer engagement, or personalizing messaging, our strategies are designed to achieve the highest possible return and meet your unique business objectives.
5. Execution & Automation
With the strategy in place, we execute targeted ads, personalized campaigns, and automated workflows that engage customers at the right time and through the right channels. Automation ensures that your marketing efforts are running smoothly and consistently, allowing us to scale efforts quickly and efficiently.
6. Measurement & Optimization
Finally, we measure the success of our campaigns by tracking key performance indicators (KPIs) such as Customer Acquisition Cost (CAC), Customer Lifetime Value (CLV), ROI, and conversion rates. Based on this data, we continuously optimize and refine our approach, ensuring that your marketing efforts evolve with your business needs and market trends.
Quantitative marketing research process roadmap

The quantitative research process follows a five-step process, which is as follows:
1. Problem definition
The first stage is defining the problem statement. It requires answering a few questions like:
- What is the point of conflict?
- What do we aim to find a solution to?
- Which information is needed?
Here, you must also create a hypothesis based on which you will assess your final result.
For example, suppose the problem statement is ‘Consumer perception of travel apps among teenagers in the USA.’ The hypothesis can be ‘Teenagers in the USA do not prefer using travel apps.’ The final result of the research will either prove or disprove the hypothesis.
You need to note that both the problem statement and the hypothesis must be specific regarding the idea, the target population, age group, the region, etc.
2. Research design
The next stage requires you to create the research design. Here, you need to specify what methodologies you will use to conduct the research. Research design establishes an outline for the study and guides how the research will be conducted.
The critical elements of research design are:
- Specific purpose statement
- Research techniques and methods
- Type of Research
- Possible objections to the research
- Settings for the study
- Timeline of the research
- Assumptions and limitations of the study
3. Data collection
Once you define the problem statement and the research design, you must begin with the actual research by collecting relevant data from various sources. The data collection technique will differ based on the type of research: primary or secondary. Ideal research involves elements of both primary and secondary research.
| Primary research | It is a type of research in which the researcher gathers first-hand information from the target population by conducting surveys, experiments, interviews, etc. |
| Secondary research | It is a type of research in which the researcher relies on already published information and the research already conducted to draw conclusions for the current study. |
4. Data analysis and interpretation
Collected data is of no use by itself, and you need to analyze and interpret the data to generate meaningful conclusions. You can create charts, tables, graphs, and other diagrams to quickly present and analyze the information.
However, you must note that data analysis and interpretation are two different processes. Data analysis is the process of structuring, organizing, transforming, and modeling the data to observe trends and patterns. On the other hand, data interpretation assigns meaning to the analyzed data. It involves determining the relationship between different variables, how the information is significant to us, and so on.
5. Report writing
The final stage in the research process is writing a report. A report is usually very detailed and contains all the findings and conclusions of the research.
It includes headings such as:
- Executive summary
- Introduction
- Research objective
- Research Methodology
- Primary and secondary research findings
- Charts and diagrams for data analysis
- Data interpretation
- Conclusion
- Annexure
Marketers can use this report to understand the market trends, draft marketing strategies, present the findings to the clients, and for future marketing purposes.
Quantitative marketing data collection techniques
As discussed earlier, data collection is of two types: primary and secondary data collection. The techniques for both these methods are as follows:
Primary data collection techniques

1. Surveys
This technique typically requires the respondents to answer a list of questions related to the research problem. Quantitative research surveys have close-ended questions easing the respondent’s work and making the results specific and accurate. Traditionally, researchers relied on pen and paper to conduct surveys by individually contacting the sample. But now, we have tools like Google Forms and Microsoft Forms, making reaching a wider group of people easier.
2. Interviews
Interviews involve a detailed interaction between the researcher and the interviewee. Quantitative interview questions are structured to gather extensive information from the participants. The researcher can conduct the interview face-to-face, over the telephone, or via video conference.
3. Observations
This technique does not require asking any questions to people. It involves the recording of factual information through observation. The researcher observes instances and notes down the key highlights. This type of data collection is objective as it does not depend on a person’s memory or personal bias.
Secondary data collection techniques
The secondary research does not require the researcher to personally collect the data by contacting a group of people. It depends on the data already available or what someone else has recorded. Based on this information, the researcher draws insights and inferences. Secondary data sources can include research papers, blogs, books, videos, etc.

Types of quantitative research questions
The questions that researchers ask while conducting quantitative research are specific compared to open-ended qualitative questions, which are harder to analyze.
The major types of quantitative market research questions are:
1. Net promoter score
You can ask this question to determine customer satisfaction and brand shareability. Based on the responses, you can divide the respondents into three categories: promoters, passives, and detractors. This question usually has a 0-10 scale providing an efficient perspective about brand recommendation.
For example,
Considering your experience with us, how likely would you recommend our services to a friend?
| 0 | 1 | 2 | 3 | 4 | 5 | 6 | 7 | 8 | 9 | 10 |
10- Very likely
2. Likert scale
This question evaluates a respondent’s opinion toward a particular situation. It has two extreme opinions at each end of the scale. This type of question is usually asked to know the agreement level of the respondent to a particular statement or situation. It typically has 5, 7, or 9 options to choose from.
For example,
Do you agree with the statement, “App marketing is as crucial as the other app development stages”?
| Strongly disagree | Disagree | Neutral | Agree | Strongly agree |
3. Semantic scale
A semantic differential rating scale is used to generate quantitative data about ideologies, products, or events with drastically opposing answers at the polar points of the scale to quantify their implicative meaning.
For example,
How satisfied are you with our customer service?
| Extremely dissatisfied | Dissatisfied | Neutral | Satisfied | Extremely satisfied |
4. Multiple-choice
These questions are crucial as they help in getting the best responses. The reason is that the marketer gives the respondent the exact options to choose from, and the analysis thus becomes more straightforward and quantifiable. The question can be designed in a way that the respondent can choose either only one option or multiple options.
For example,
Which video streaming platform do you prefer using?
- YouTube
- TikTok
- Netflix
- Amazon Prime Video
- Hulu
- Disney+
Statistical analysis techniques used in quantitative research

Various statistical analysis techniques can be used to analyze quantitative research data. Some of them are listed below:
1. TURF analysis
Total Unduplicated Reach and Frequency (TURF) analysis is a statistical approach to assess the potential of market research for a combination of products and services. With firms launching products and services regularly and new markets being explored daily, it becomes inevitable to leave no stone unturned in ensuring the products are well-received in new areas.
For example, if an app company wishes to launch a new feature, TURF analysis can help answer the following questions:
- What market share will we receive if we introduce Feature X in our app?
- Where should we promote this feature to get maximum reach in the app industry?
2. Conjoint analysis
Conjoint analysis is a way of determining the worth of numerous aspects for customers, such as pricing, features, and benefits that lead to purchasing a specific product or service. With the increasing technology integration in devices and gadgets, this analysis method has become common for product pricing, market positioning, and product introduction.
3. Gap analysis
Gap analysis is a technique for assessing the difference between the desired and the actual performance of a product or service. By measuring this, a firm can make efforts to close the gap and make its features more enticing.
Businesses use gap analysis to answer the following questions:
- What is the current position of the company?
- Where do we wish to reach?
- What can we do to close the gap?
4. MaxDiff analysis
MaxDiff analysis, also known as best-worst scaling, is used to gauge survey respondents’ preference scores for multiple attributes such as product features, brand image, activities around branding, etc. This technique is similar to conjoint analysis; however, MaxDiff analysis is easier and more comprehensive in analyzing critical situations.
5. Cross tabulation
As the name suggests, cross-tabulation allows you to compare two or more categories in a tabular format for quicker analysis. Researchers utilize cross-tabulation to look for hidden relationships in data. It’s great for market research and surveys as a cross-tab report depicts the relationship between two or more study questions.
Errors in quantitative marketing research
The following table summarizes the different types of errors that might arise while conducting quantitative marketing research:
| Random sampling errors: 1. Sample too small 2. Non-representative sample 3. Incorrect sampling method selection | Research design errors: 1. Bias introduced 2. Measurement error 3. Data analysis error 4. Scaling error 5. Population definition error 6. Question formation error 7. Sampling frame error |
| Interviewer errors: 1. Questioning errors 2. Cheating errors 3. Recording errors 4. Respondent selection error | Respondent errors: 1. Non-response error 2. Inability error 3. Falsification error |
Apart from the above errors, the study can also have hypothesis errors, which are of two types:
- Alpha error, in which the study outcomes lead to the rejection of the hypothesis even though it is true.
- Beta error, in which the study outcomes lead to the acceptance of the hypothesis even though it is false.
Challenges of Implementing Quantitative Marketing
After working with numerous clients and helping them implement quantitative marketing, we’ve encountered a range of challenges along the way. These challenges are common but can be easily tackled with the right approach. Here’s how we’ve handled some of the most common obstacles and how you can overcome them too:
1. Data Silos: The Foundation of Fragmented Insights
In larger organizations, data often lives in isolated systems, from CRMs to ad platforms to support desks. This fragmentation creates gaps in understanding the full customer journey, making accurate analysis and attribution tough.
How We Overcome It:
We use APIs to integrate different systems, ensuring smooth data flow across platforms. A Customer Data Platform (CDP) is also key to centralizing customer information into unified profiles. Additionally, we implement a Data Warehouse to house everything in one place, making analysis easier and more effective.
2. Attribution Complexity: Who Gets the Credit?
The customer journey today isn’t linear, with multiple touchpoints across various channels before a conversion. Relying on last-click attribution can leave many valuable interactions underappreciated.
How We Overcome It:
We implement Multi-Touch Attribution (MTA) models like Linear and Time-Decay to give credit across touchpoints. For even more precision, we explore algorithmic attribution, which uses machine learning to intelligently distribute credit based on the actual impact of each touchpoint.
3. Data Quality Issues: Garbage In, Garbage Out
Poor data quality, whether from duplicates, inconsistencies, or outdated info, can lead to inaccurate insights, resulting in misguided decisions and wasted budget.
How We Overcome It:
We start with data hygiene protocols, enforcing standardized formats for all entries. We also set up automated validation tools that cleanse the data in real time, ensuring only accurate data enters the system. Regular data audits help us stay on top of any issues.
4. Over-reliance on Metrics: Losing the Human Story
While quantitative metrics are essential, it’s easy to get caught up in vanity metrics like page views, which may not directly impact the bottom line. Focusing too heavily on these numbers can cause us to miss the human elements behind customer behavior.
How We Overcome It:
We balance quantitative data with qualitative insights. This means using surveys, interviews, and customer feedback to understand the why behind the numbers. We also ensure all KPIs tie directly to business outcomes, like revenue or lifetime value, so we focus on metrics that truly matter.
Tools & APIs for Implementing Quantitative Marketing
A solid quantitative marketing strategy relies on tools for tracking data, integrating customer insights, and running experiments. These help optimize campaigns, automate processes, and make smarter, data-driven decisions.
1. Analytics & Behavioral Tracking Tools
These tools act as your eyes and ears, gathering data on how users interact with your digital properties.
- Google Analytics 4 (GA4): The gold standard for tracking user behavior across platforms, GA4 is essential for understanding web traffic and user engagement, offering robust integration with other Google tools like Google Ads.
- Mixpanel: It goes deeper by tracking specific user actions, making it ideal for product-led growth. Mixpanel helps analyze funnels, retention, and segmentation.
- Heap: Automatically tracks every user interaction, from clicks to form entries, without needing manual tagging, which accelerates data collection and reduces implementation time.
2. CRM & Customer Data Platforms
CRMs and CDPs unify fragmented data and give you a clear, actionable view of each customer, fueling your marketing strategy.
- HubSpot: An all-in-one platform combining CRM, marketing automation, and sales tools, HubSpot is excellent for managing the customer lifecycle in mid-market companies.
- Salesforce: The enterprise-grade CRM leader, Salesforce offers robust features for email marketing, audience segmentation, and multi-channel marketing automation.
- Segment: As a pure-play CDP, Segment consolidates customer data from various sources, cleans it, and syncs it across your tech stack for seamless integration and real-time personalization.
Why They Matter: These platforms eliminate data silos, enabling you to create personalized experiences and track multi-touch attribution throughout the entire customer journey.
3. A/B Testing & Experimentation Platforms
Tools like Optimizely, VWO, and Google Optimize help you test and refine your marketing strategies with real data. They take the guesswork out by letting you run A/B and multivariate tests, so you can see what actually drives results. In the end, they help you fine-tune campaigns for higher conversions and better performance.
4. Machine Learning APIs & Frameworks
Tools like Google Vertex AI, AWS SageMaker, TensorFlow, and PyTorch let you predict customer behavior and automate decisions at scale. They help you go beyond basic data analysis and create personalized experiences or retain customers before problems arise. In short, they make your decisions smarter and more efficient.
5. Multi-Touch Attribution Tools
Tools like Ruler Analytics, HubSpot Attribution, and Wicked Reports help track the full customer journey, not just the final click. They show how different marketing efforts contribute to revenue, giving you a clearer picture of what’s driving results. This lets you allocate your budget more effectively, ensuring you invest in the right channels.
6. Data Visualization & Business Intelligence
Raw data is overwhelming unless it’s presented clearly. BI tools help transform complex datasets into actionable insights through dashboards and visual reports.
- Power BI: A robust BI tool from Microsoft, Power BI is known for its deep integration with Microsoft products and its ability to create detailed, enterprise-level reports and dashboards.
- Tableau: A leader in data visualization, Tableau excels at connecting to virtually any data source and creating powerful, customizable dashboards.
- Looker: Now part of Google Cloud, Looker enables consistent data modeling and reporting, ensuring everyone across the organization is working from the same metrics.
Why They Matter: They provide accessible, real-time insights, enabling marketers and business leaders to make quick, informed decisions and spot trends as they happen.
Market research in the app industry
App development is a sector that requires intensive research about the market. It includes the analysis of the target audience, the competitors, and the various other associated factors. A business starting in this sector might find it overwhelming to conduct thorough market research without proper guidance. As a result, it is better to consult app development experts for this task.
Idea Usher is a technology company providing various digital services like app development, blockchain development, AI and IoT-related services, etc. In addition to qualified app developers, we also have experts who assist clients in understanding the feasibility of their app idea by conducting a thorough analysis of the target market. Once the feasibility is confirmed, we help turn the app idea into reality through our development services.
Contact us to get a clear vision of your app idea and take off your app business.
E-mail: [email protected]
Phone Numbers : (+91) 946 340 7140, (+91) 859 140 7140, and (+1) 732 962 4560
Use Case: Quantitative Marketing in a B2B SaaS Platform
We recently worked with a B2B SaaS platform that was grappling with rising customer acquisition costs and flat conversion rates. Despite pouring money into paid ads, they were getting leads, but the quality just wasn’t there, and sales were having a tough time closing deals.
They knew something wasn’t working, but couldn’t pinpoint where the issue was. Relying on gut feelings and last-click attribution, they ended up wasting money without seeing the growth they expected.
The Challenge
- Unjustifiable Ad Spend: Their CAC increased by 45% year-over-year, but they couldn’t figure out which campaigns were driving high-quality leads.
- Unclear Attribution: Marketing claimed they were generating leads, but sales said they were low-quality. Data from Google Ads, LinkedIn, and Salesforce was siloed, making it impossible to get a complete picture.
- Early Churn: Even when they acquired customers, many churned within the first 90 days, diminishing their return on investment.
Our Data-Driven Approach:
We moved beyond guesswork by implementing a comprehensive, data-first strategy.
Data Integration
We broke down the data silos by implementing a Customer Data Platform (CDP) that unified their advertising platforms, website data, and Salesforce CRM. This gave them a full, multi-touch view of each lead’s journey from the first click to a closed deal.
Hypothesis-Driven A/B Testing
With the unified data, we hypothesized that redesigning the landing page to focus on enterprise pain points and adding a case study video would increase conversions. We ran a controlled A/B test and tracked not only form fills but the quality of leads passed to sales.
Predictive Churn Modeling
To address retention, we built a predictive model using machine learning to identify churn patterns based on early behaviors, like low feature adoption or minimal logins. We assigned a “churn risk score” to each customer, allowing proactive interventions.
Machine Learning-Powered Ad Optimization
By leveraging the new attribution data, we optimized their ad strategy. Using Salesforce data, we created value-based audiences on Google Ads and LinkedIn, enabling the algorithm to find users who resembled their highest-value customers.
Tangible Results
- 30% Lower CAC: By reallocating budget to the most effective channels and audiences, we significantly reduced ad spend while improving lead quality.
- 25% Increase in Conversion Rate: The new landing page variant helped qualify leads more effectively, making the sales team more efficient and productive.
- 20% Higher Retention: Using churn risk scores, the customer success team prioritized outreach and successfully saved 20% of at-risk customers through targeted nurturing and personalized onboarding.
Summing up
Quantitative marketing research is an excellent way for marketers to understand the market situation and plan their marketing strategies accordingly. The results obtained through the research can be used to derive insightful conclusions because of their precise nature.
Expert tip: Always aim to keep your research objective, specific, and bias-free to ensure better outcomes and marketing decisions.
Looking to Implement Quantitative Marketing?
At IdeaUsher, we don’t just provide reports, we build the data engines that power your marketing success. Our approach goes beyond analytics; we implement integrated systems, predictive models, and AI-driven automation to turn your marketing into a predictable, scalable growth engine.
Why Partner with IdeaUsher?
500,000+ Hours of Coding Experience: This isn’t just a number—it’s the depth of expertise that fuels our ability to solve complex problems efficiently. With over half a million hours of coding experience, we ensure your project is executed flawlessly from day one.
Ex-MAANG/FAANG Developer Expertise: Our team is made up of top-tier developers who have built and scaled systems at some of the world’s leading tech companies. They bring an elite engineering mindset, ensuring that your marketing systems are not only functional but also secure, scalable, and fast.
Full-Stack Quantitative Implementation: We handle every aspect of making your marketing data-driven:
- Data Unification: We break down silos, creating a single, integrated view of your customers with custom integrations and Customer Data Platforms (CDPs).
- Attribution Architecture: We implement advanced multi-touch attribution models, so you know exactly which marketing efforts are driving revenue.
- Predictive Model Development: Our custom machine learning models forecast churn, predict customer lifetime value (LTV), and identify your highest-value segments.
- Automation & Integration: We connect your entire marketing stack, enabling real-time personalization and automated workflows that increase efficiency.
Check out our latest projects to see the transformative work we can deliver for you!


Frequently asked questions
Here are a few exciting FAQs about quantitative marketing.
A1: Quantitative marketing focuses on data and measurable outcomes, using analytics to guide decisions, whereas traditional marketing often relies on intuition, experience, or qualitative feedback. This makes quantitative marketing more precise and scalable, allowing for real-time adjustments and continuous improvement.
A2: Absolutely. While the full impact of quantitative marketing is often most visible in larger enterprises with vast data, small businesses can still gain valuable insights. By tracking key metrics and optimizing based on data, even smaller operations can improve efficiency, reduce costs, and boost their marketing ROI.
A3: Enterprises should track several key performance indicators to gauge success, including Customer Acquisition Cost, Customer Lifetime Value, conversion rates, Return on Ad Spend, and churn rates. These metrics provide a comprehensive picture of marketing effectiveness, helping businesses fine-tune their strategies and allocate resources more effectively.
A4: While AI can significantly enhance the optimization process by analyzing large datasets and identifying patterns, it can’t fully automate quantitative marketing. Human oversight is crucial to ensure that AI-driven strategies are ethical, relevant, and aligned with the company’s broader objectives and values.


